


Introduction
Skeletal muscle dysfunction is a common occurrence in patients with chronic obstructive pulmonary disease (COPD). Limb muscle dysfunction not only contributes to exercise intolerance, but also contributes to COPD morbidity and adversely affects life expectancy [1]. Several studies have reported that decreased muscle mass or strength is associated with increased mortality, suggesting the importance of monitoring changes in these parameters in patients with COPD [2].
In patients with COPD, upper extremity muscle strength is relatively maintained, whereas lower extremity muscle strength is reduced [3,4]. Similar to the general population, muscle weakness in the quadriceps is associated with mortality in patients with COPD [5,6]. Muscle endurance refers to the ability to sustain a specific task and is determined by complex processes such as adequate muscle oxygen supply and oxygen extraction from the muscles. The reduction in exercise endurance in patients with COPD is due to changes in the distribution of muscle fiber types, with a decreased proportion of type I fibers and an increased proportion of type IIb fibers, as well as a decrease in muscle oxidative capacity [7,8].
During the course of the disease, muscle changes may occur before the deterioration of respiratory function [9]. Therefore, examining changes in muscle quality according to the severity of COPD is important for predicting the deterioration of physical function. Surface electromyography (sEMG) is a noninvasive method that can be used to evaluate muscle condition during activity. The assessment of neuromuscular fatigue using sEMG during dynamic exercise in patients with COPD has already been investigated [10]. The purpose of our study was to examine differences in the severity of COPD based on sEMG and to clarify its relationship with physical function. In particular, we aimed to determine whether sEMG signals for muscle fatigue can better reflect the course of the disease.
Materials and Methods
1) Subjects
This prospective study included patients diagnosed with COPD at a single center between April 2019 and 2020. Overall, 24 patients diagnosed with COPD were recruited for the study. The diagnostic criteria for COPD were based on the 2019 Global Initiative for Chronic Obstructive Lung Disease (GOLD) guidelines and included patients with a post-bronchodilation ratio of forced expiratory volume in 1 second (FEV1) to forced vital capacity (FVC) <0.7. The inclusion criteria were patients >40 years old and had symptoms such as difficulty in breathing or difficulty performing activities of daily living. Patients with cancer, heart failure, coronary artery disease, cerebrovascular disease, heart failure, diabetes with severe complications, or uncontrolled hypertension were excluded. Patients who were unable to walk independently at the time of enrollment were also excluded. Patients were categorized according to the modified Medical Research Council (mMRC) scale and GOLD stage.
2) Experimental design
(1) sEMG
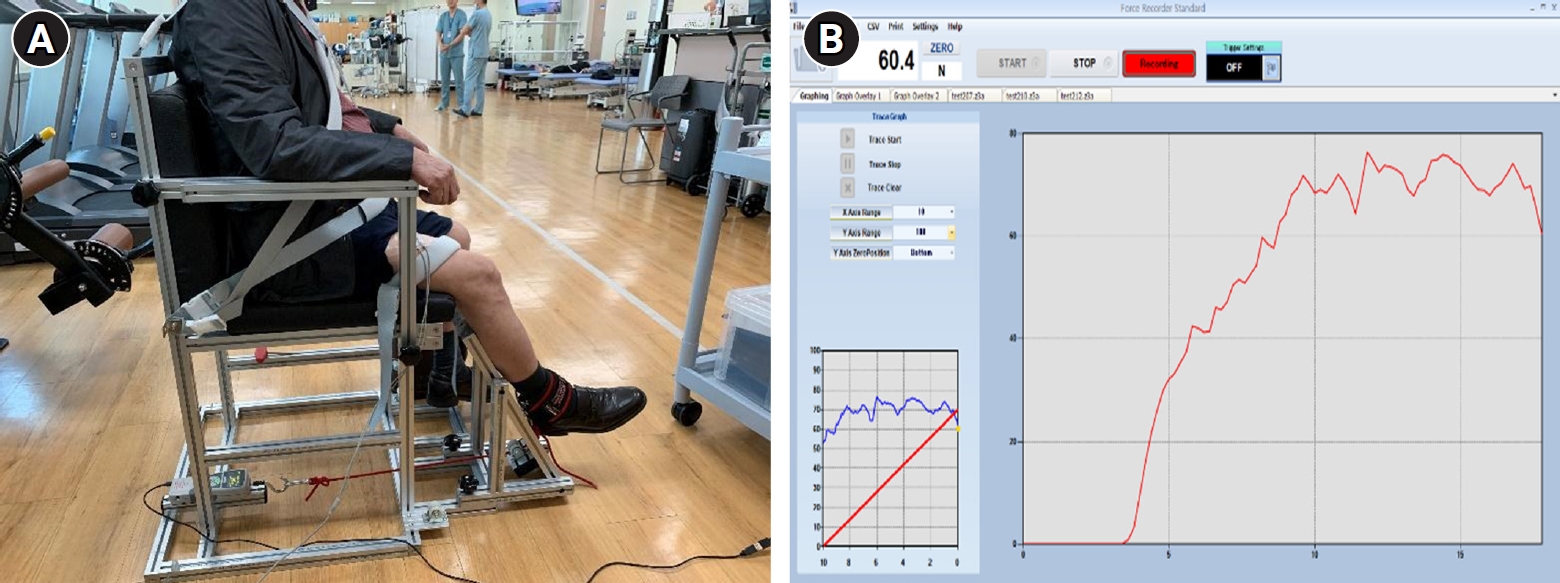
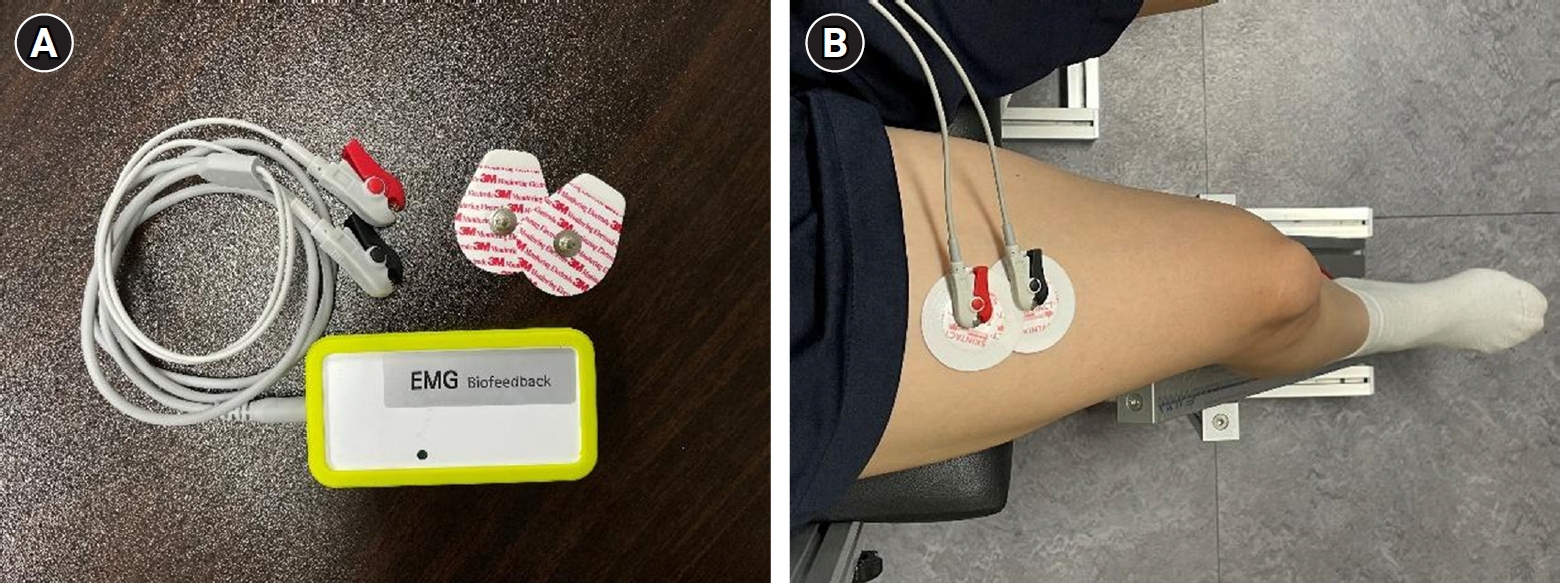
Subjects performed maximum voluntary isometric contraction (MVIC) and ramp contraction during unilateral isometric knee extension (60° knee angle). During the assessments, the physiotherapist (H.J.S.) gave verbal cues to the patient to perform the movements and assume the correct posture. The rectus femoris (RF) muscle of the dominant leg was measured [11]. A self-designed chair-type equipment was used to fix the parts other than the moving joints during RF muscle contraction. (Fig. 1A) [12]. RF muscle strength was measured using a digital tension meter (ZTS-500N; Imada Inc., Tokyo, Japan) (Fig. 1B). The root mean square (RMS) values of the RF muscle were measured using an sEMG device (PSL-EMG-Tr1; PhysioLab Co., Ltd., Busan, Korea) (Fig. 2A), and the electrode attachment site was set by referring to the standard electrode position suggested by Surface Electromyography for the Non-Invasive Assessment of Muscles (SENIAM) (Fig. 2B) [13]. To familiarize the participants with the equipment, submaximal isometric contraction trials, corresponding to approximately 20% of MVIC, were attempted as a warm-up [12]. The subjects then performed two 5-s-long MVIC trials, with at least 5 minutes of rest between trials; the maximum value was then selected. If the RMS values of MVIC differed by more than 5% from each other, a third measurement was taken and the largest of the measurements was selected [12]. The RMS value was taken, divided by the MVIC value, and the %MVIC, which is a value converted into a percentage, was used to analyze the normalized RMS value in the ramp exercise test of the RF muscle. The ramp exercise test consists of a gradual increase in knee extension (60° knee angle) force from baseline to the maximum in 10 seconds to reach 70% of MVIC and maintained for 5 seconds [11,12]. Measurements were performed twice with a sufficient rest period of at least 5 minutes between measurements. After the test, the most linear increase in time and muscle strength was selected by visual inspection and used for the analysis. In both tests, visual biofeedback and verbal encouragement were provided to achieve the highest level of muscle strength.
(2) Physical function assessment
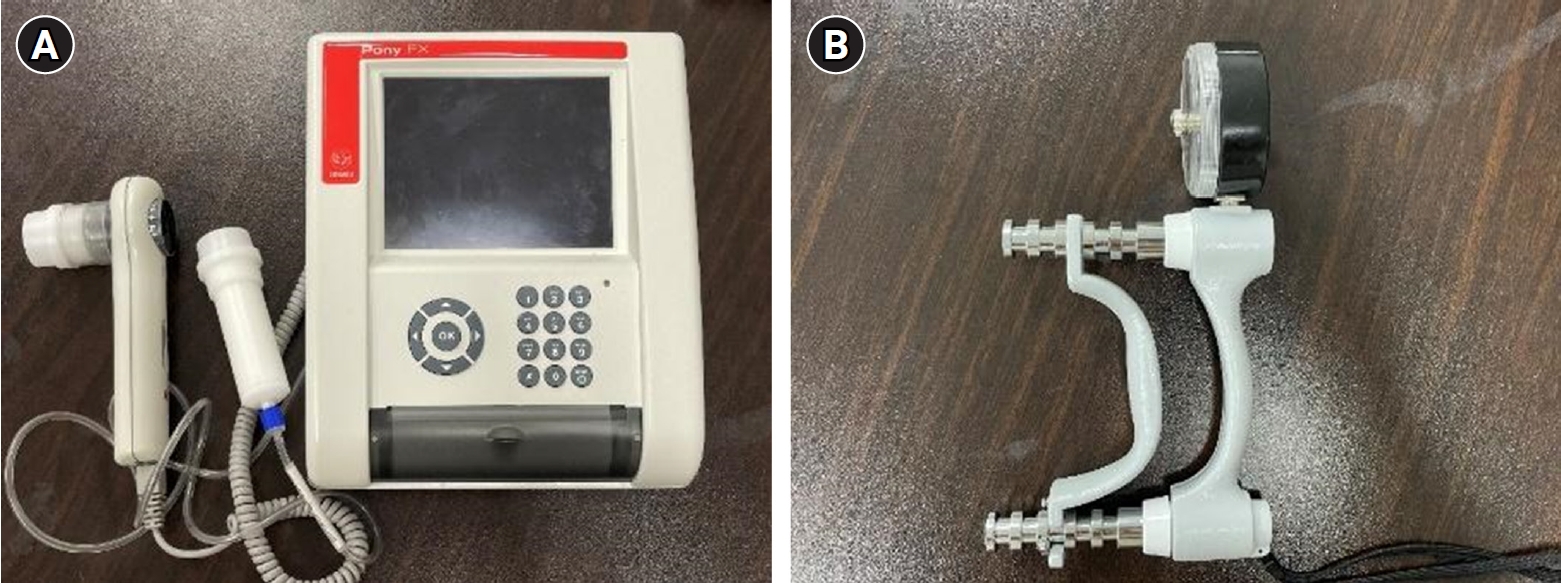
Dyspnea was evaluated using the mMRC scale, which consists of five items that assess the severity of dyspnea from none (grade 0) to almost complete incapacity (grade 4). Additionally, baseline pulmonary function, respiratory muscle strength, grip strength, and cardiopulmonary endurance were obtained. The physical function assessments were conducted by a trained physiotherapist (H.J.S.). Pulmonary function and respiratory muscle strength were measured using a spirometer (Font Fx, Cosmed, Italy) (Fig. 3A), and FVC, FEV1, FVC/FEV1, and maximal inspiratory and maximal expiratory pressures were evaluated. Pulmonary function and respiratory muscle strength tests were performed in all subjects during the initial evaluation according to previously described guidelines [14]. Grip strength was measured thrice using a hand dynamometer (SH5001; Saehan Co., Korea), and the maximum value was recorded (Fig. 3B). Cardiopulmonary endurance was measured using the 6-minute walk test (6MWT) according to the American Thoracic Society’s Pulmonary Function Standard Committee guideline [15]. The 6MWT was recorded as a value evaluated once using a 30-m-long track with marks every 3 m.
3) Data analysis
The sEMG signal is the electrical activity reflecting the level of muscle contraction, and its parameters can be calculated using frequency analysis. The signal in a ramp exercise can be expressed as a relative value, such as %MVIC [16]. Using the absolute value, such as the RMS of sEMG, may cause signal differences depending on variables that occur when measuring sEMG, such as skin movement and muscle length discrepancies both between and within subjects. Therefore, it is also common to perform comparative analyses using the ratio of the reference value [17]. In this study, among the RMS values of MVIC, the values for the middle 2 seconds, excluding the first and last seconds, among the collected 5-second signals were analyzed. MVIC was used to normalize %MVIC, and the formula used to determine %MVIC was as follows:
Frequency analysis is the most commonly used method for identifying the characteristics of complicated signals such as those of sEMG [18]. Accordingly, the main frequency band of the sEMG signal and amplitude of each frequency component are known. The methods for calculating the main frequency domain or range are median frequency (MDF) and mean power frequency. In this study, MDF was used. The MDF is the frequency value that divides the power spectrum (P[f]) into two regions with equal amplitudes. Mean values were calculated throughout the frames. The MDF was calculated as follows:
The fatigue index is used as a general-purpose indicator for detecting muscle fatigue. When muscle fatigue due to excessive muscle contraction occurs, MDF decreases [19]. The equation for fatigue index is as follows:
In the above equation, MDFmax is the maximum value of the MDF immediately before the MDF decreases due to fatigue. MDFmin is the minimum value of the MDF reduced by fatigue.
4) Statistical analysis
One-way analysis of variance (ANOVA) was performed to determine whether there was a significant difference in the values of each parameter between the three groups. We used the Scheffe method and post-analysis one-way ANOVA [20]. The patients were divided into three groups according to the mMRC grade and GOLD stage, and a statistical analysis was performed.
5) Ethical statement
The study protocol was approved by the Pusan National University Hospital Institutional Review Board (IRB number:1904-014-077) on April 29, 2019. This study was conducted in accordance with the Declaration of Helsinki. Written consent was obtained from all participants prior to the study.
Results
Overall, 24 patients were enrolled in the study. Patients were classified into groups according to the mMRC grade and GOLD stage. Patients with mMRC grades 0 and 1 were classified into group A, grade 2 into group B, and grades 3 and 4 into group C. Patients with GOLD stage 1 were classified into group I, stage 2 into group II, and stages 3 and 4 into group III. The mean age of the patients was 69.9 ± 8.7 years, and there were 23 men and 1 woman. Table 1 presents the patients’ characteristics. Table 2 shows the mean and standard deviation of physical function assessments for each mMRC and GOLD group, while Table 3 shows the mean and standard deviation of sEMG parameters in those groups. As the mMRC grade increased, sEMG parameters tended to decrease, except for %MVIC and the fatigue index. The maximum strength, MDF, and MVIC were inversely proportional to the mMRC grade and directly proportional to the fatigue index. In contrast, the sEMG parameters and GOLD did not show any trend. Table 4 shows whether there were statistically significant differences in the sEMG parameters according to the mMRC and GOLD groups. Among the mMRC groups, there were no significant differences in the mean values for maximal strength, MDF, MVIC, or %MVIC; however, there was a significant difference in the fatigue index. For the fatigue index, a statistically significant difference was found among all groups. The results suggest that the mMRC grade has a higher correlation with muscle quality after contraction than with physical ability and during pre-contraction. Meanwhile, there were no significant differences in any parameters among the GOLD groups.
Discussion
We investigated the relationships between subjective dyspnea, muscle strength, and fatigue using sEMG. No significant difference was found in muscle fatigue according to the GOLD stage, but it was different according to the mMRC grade. Compared to air-flow obstruction, a high score of the mMRC was associated with poor maximum capacity for exercise [21]. Similarly, in our study, when leg fatigue was induced with submaximal contraction, it is thought that the patients’ dyspnea symptoms influenced the maximum strength of the lower limb muscle. Furthermore, lower limb muscle fatigue, as determined by the fatigue index, was more strongly correlated with dyspnea than with muscle strength. Using the mMRC questionnaire could be useful in clinical practice because they can predict a patient’s exercise capacity and level of physical activity when performing activities of daily living.
The goal of COPD assessment is to evaluate a patient’s health status, predict disease exacerbation, and set treatment directions. COPD can be assessed based on the severity of airflow limitation and symptoms [22]. Methods of stratifying the severity of dyspnea in COPD, such as the mMRC scale, and health status questionnaires, such as the COPD assessment test, were used to assess symptoms. The mMRC scale is a simple assessment tool that predicts the mortality risk of patients with COPD. In COPD, the mMRC grade and cardiopulmonary exercise test (CPET) are closely related and predictive of exercise tolerance; patients with higher dyspnea scores on the mMRC scale complained of more severe dyspnea after CPET [21]. Similarly, our study found a close relationship between dyspnea perception and leg fatigue induced by submaximal isometric contraction, which was not related to the severity of airflow obstruction.
The lower limb muscles of patients with COPD are affected by both the quality and quantity of muscles, and leg fatigue is a common cause of exercise intolerance [23]. A decrease in muscle mass and changes in its composition are not only directly caused by muscle weakness, but can also cause a decrease in exercise capacity. Structural abnormalities are present in the quadriceps of patients with advanced COPD due to atrophy, mainly caused by a shift in muscle fibers from type I to type II. Additionally, the number of capillaries per muscle fiber and capillary density are decreased in the limb muscles of patients with COPD [1]. Because of these changes, assessments of limb muscle quality may become more important than those of muscle mass in patients with COPD. It was also reported that quadriceps endurance was lower in COPD patients than in healthy individuals, which is related to muscle oxidative capacity and not muscle mass [21]. Limb muscle fatigue can be explained by blood redistribution during high-intensity exercise and reduced muscle capillarity, which promotes fatigability by causing problems with blood and oxygen delivery [24]. Furthermore, metabolic changes in muscles that increase dependence on glycolytic metabolism are associated with muscle fatigue in patients with COPD [25].
Muscle strength in patients with COPD is generally better preserved in the upper limbs than in the lower limbs. Among the lower limb muscles, the quadriceps muscle, which is easily accessible, is mainly evaluated for muscle strength and endurance by volitional and non-volitional assessments [3]. Regardless of the assessment tools, patients with COPD mainly show reduced muscle strength and endurance compared to healthy individuals [26]. Endurance tests in patients with COPD may be discontinued before reaching maximal exercise capacity due to fatigue, dyspnea, and anxiety [27]. The MDF of muscles on sEMG can compensate for the disadvantages of the endurance test and can serve as an indirect marker that can predict contractile fatigue. In our study, we revealed that the lower limb muscle fatigue index can be evaluated using sEMG even in patients with severe COPD for whom exercise stress testing is difficult to perform.
This study had some limitations. First, this study had a small sample size, which can reduce the power of the results, and the findings may be difficult to apply to all patients with COPD. Second, we did not include an age-matched control group. As muscle fatigue is affected not only by the severity of COPD but also by age, the interpretation of the results requires caution. Future studies should overcome these limitations and propose reliable testing methods that can be adapted to patients with COPD as a whole.
Conclusion
The sEMG signal from the lower limb muscle in COPD during fatiguing exercise was correlated with the patient's subjective dyspnea. Furthermore, we confirmed that the muscle fatigue index in patients with severe COPD could be quantified using sEMG. The importance of the mMRC score was confirmed for the rehabilitation of COPD patients, and the potential of sEMG as a complementary measure was demonstrated.