


Introduction
Carpal tunnel syndrome (CTS) is one of the most common entrapment neuropathies. It is prevalent among middle-aged women and workers exposed to repetitive tasks, forceful exertions, and awkward postures.1,2 Previous investigators have suggested that increased carpal tunnel pressure during repetitive hand activity may contribute to the development of CTS by initiating a cascade of events leading to median nerve entrapment.3,4 In the early stages of CTS, the patient experiences numbness in the hand. As the disease progresses, symptoms such as pain in the forearm and hand, and thenar muscle atrophy could occur.5 Tissue degeneration occurs more frequently than inflammation in overuse syndrome. Hence, a diagnosis of overuse syndrome may be established in patients with physical dysfunction.6 Moreover, the treatment of Carpal tunnel syndrome depends on its severity. Symptoms can be improved with conservative treatment in mild cases, but decompression surgery should be performed in severe cases or axonal degeneration,7 and therefore, early diagnosis is crucial.
Repetitive tasks and awkward postures can trigger both ischemic and mechanical local damage mechanisms that may lead to temporary changes in membrane excitability and decreased nerve conduction velocity, thus causing conduction block.
Nerve conduction studies (NCS) have been the gold standard in the diagnosis of CTS. Many studies have determined the severity of CTS using NCS.8 NCS can evaluate the location and severity of nerve damage. However, alterations in NCS are undetectable until some degree of demyelination or axonal damage has occurred in the large myelinated nerve fibers.9,10 Needle electromyography (EMG) may be useful in the thenar muscles in patients with a high probability of a clinical diagnosis of CTS, even if NCS results are normal. As needle EMG is invasive, it is not necessarily used in CTS studies.11 Therefore, a study on surface electromyography (SEMG) signal acquisition and processing has been underway for the last several years.
SEMG is a noninvasive technique that uses surface electrodes attached to the skin to measure the activity of the muscle. Root Mean Square (RMS) that can reflect muscle conduction amplitude, and median power frequency (MDF) and mean power frequency (MNF) from frequency spectrum analysis are used as a fatigue index in the muscle fatigue analysis based on SEMG.12
There are few studies on the application of SEMG in patients with CTS. Rainoldi et al. investigated SEMG signal alterations of the thenar muscle in patients with severe CTS.6 They found lower SEMG parameters in subjects with severe CTS compared to controls. There has been no study on the correlation between SEMG signal change and NCS of the thenar muscle according to the severity in patients with CTS.
The purpose of this study is to
(a) examine the correlation between SEMG signal change and conventional NCS according to the severity in patients with CTS
(b) identify whether SEMG shows significant signal changes in patients with CTS compared to healthy subjects
Based on these results, we aimed to determine if SEMG could provide additional information to conventional NCS in patients with mild CTS.
Materials and methods
Subjects
We prospectively studied patients who showed symptoms of numbness, pain in the hands, or thenar muscle weakness at a single center (Department of Physical & Rehabilitation Medicine, OO University School of Medicine, Korea) from November 2019 to February 2020. NCS was performed to exclude patients with radiculopathy, polyneuropathy, and motor neuron disease, and target patients diagnosed with CTS. We excluded patients with a history of wrist surgery, wrist fracture, chronic alcohol use, or the use of medication, including chemotherapy. We recruited asymptomatic age and sex-matched individuals as controls. The study protocol was approved by the OO University Hospital Institutional Review Board (IRB number: 2019-10-070) on December 23, 2019. We received written consent from all subjects before the study.
Electrophysiological evaluation
We conducted motor-sensory NCS of the median and ulnar nerve in each patient using the KeypointŌōć electromyography machine (Dantec, Skovlunde, Denmark). The skin temperature was set to 32Ōäā. Percutaneous stimulation was performed by the standard method using a stimulator and a surface electrode. The median motor NCS was conducted by attaching an active recording electrode to the center of the abductor pollicis brevis (APB), stimulating the point 7 cm proximal to determine the onset latency and the amplitude from the baseline to the peak. Sensory NCS was conducted as an antidromic nerve conduction study. We attached an action recording electrode to the proximal phalanx of the third digit, applied stimulation at a 14 cm proximal point to the wrist and 7 cm proximal point to the palm, and measured the sensory nerve action potentials antidromically. Needle EMG was performed to exclude radiculopathy, motor neuron disease, and myopathy.
From the NCS values for sensory and motor nerves, the neurophysiological severity was divided into a scale of 0-6, where 0 corresponds to normal, and higher scale points correspond to more severe damage13 (Table 1). We used this scale to categorize the subjects into the control group (Grade 0), the mild group (Grade 1-2), and the moderate-to-severe group (Grade 3-6).
Surface EMG Study
We measured electromyography signals using the SEMG measuring system (BTS FREEEMG 300, BTS Bioengineering, Italy). We set the gain to 500 and the sampling rate to 1,000 Hz. We eliminated noise by bandpass-filtering at 50-500 Hz. A 3 cm-diameter AgCl electrode was used to record the electrode of the APB muscle.
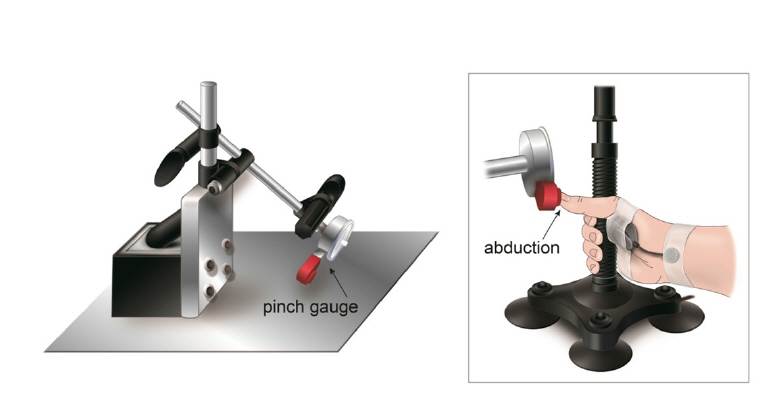
We measured the SEMG signals and the thumb abduction force for each patient by collecting the signals from the APB muscle during isometric contraction using a custom-made isometric device in a seated position (Fig. 1). It equipped a pinch gauge with a full scale of 22.5 kg that can be oriented and placed laterally to the head of the proximal thumb phalanx during the abduction tasks. Raw EMG signals were amplified, concurrently digitized, and obtained by the Myolab software (BTS FREEEMG 300, BTS Bioengineering, Italy).
Experimental protocol
We wiped the skin with alcohol, dried it to minimize resistance, and attached the electrode with a flexible adhesive tape. The subject exerted the maximal voluntary contraction (MVC), and we offered verbal stimuli as feedback to measure the isometric contraction. The maximal voluntary contraction was performed three times for thirty seconds, with a five-minute interval between each maximal voluntary contraction. Of these, we chose the highest value for analysis. We excluded the unstable data from the first and last 5 seconds and collected signals from the remaining 20 seconds to save on the computer. The force of the APB muscle was measured using the pinch gauge instrument. The value of the pinch gauge measured in kilograms was converted into Newton (1 Kilogram = 9.81 Newtons).ŌĆā
Data Management
The SEMG variables of interest were root mean square (RMS), mean (MNF), and median (MDF) frequencies of the power spectrum. These variables reflect the functional capabilities of the neuromuscular system during a voluntary task. RMS distributions explain the action potential energies during the contractions. RMS is defined as
where ί represents the procedure number of the processing sample point, raw data ί is the value of the ί th sample point, and n is the total number of the data points.14
MNF and MDF are the most valuable frequency-domain characteristics and frequently used for the evaluation of muscle fatigue in SEMG signals. MDF and MNF are defined as
where p(t,w) shows the power spectrum of EMG signals based on wavelet packet transformation.14
Neuromuscular Efficiency (NME) was calculated as the ratio between force and the corresponding RMS and measured in N/╬╝V. It is defined as 'the quotient of force and the integrated EMG.' Using this de’¼ünition, NME can be considered an estimate of the force generated per unit of EMG amplitude.6
Statistical analysis
The SPSS 21.0 statistical analysis program was used for statistical analysis. The one-way ANOVA (analysis of variance) was used to compare SEMG and NCS parameters between the control group, the mild group, and the moderate-to-severe group. When the one-way ANOVA showed a significant difference, post-hoc testing was performed using Bonferroni correction. The relationship between the SEMG parameters and NCS parameters was studied using the Pearson correlation coefficient. Simple linear regression was used to assess the effect between the correlated parameters. Statistical significance was defined as a p-value <0.05.
Results
SubjectsŌĆÖ characteristics according to the presence or absence of CTS
A total of 78 subjects (53 women) participated in the study and were included for analysis. The demographic data and clinical characteristics of the subjects are summarized in Table 2. Mean patient age was 55.94 ┬▒ 9.92 years (range: 32-79). A comparison of patient characteristics among the 3 groups is summarized in Table 3. NCS parameters and RMS of SEMG parameters showed significant differences between the 3 groups. Post-hoc analysis revealed statistically significant differences (p< 0.01) in NCS parameters and RMS values between the control group and the moderate-to-severe group. However, while RMS values did not exhibit a significant difference between the control and the mild group, or between the mild group and the moderate-to-severe group (P >0.05), some of the NCS parameters showed significant differences between the 3 groups.
Correlation of SEMG parameters and NCV parameters in CTS patients
In our findings, while RMS values were associated with NCS parameters (mid-palm-to-wrist sensory velocity) in the mild group, there was a significant correlation between RMS values and all NCS parameters in the moderate-to-severe group (Table 4). The strongest correlation coefficient was found in the finger-to-wrist sensory nerve conduction velocity of NCS parameters (r=0.744, p<0.05), and the smallest correlation coefficient was found in the motor velocity of NCS parameters (r=0.502, p<0.05). However, all NCS parameters showed no correlation with MDF and MNF in all three groups.
Linear regression analysis for the risk of decreased muscle characteristics
Linear regression was performed with the finger-to-wrist sensory nerve conduction velocity, mid-palm-to-wrist sensory nerve conduction velocity, sensory nerve action potential (SNAP), distal motor latency (DML), compound motor action potential (CMAP), and motor velocity as factors affecting RMS value. Linear regression analysis identified finger-to-wrist sensory nerve conduction velocity (╬▓=0.720, p<0.01), mid-palm-to-wrist sensory nerve conduction velocity (╬▓=0.692, p<0.01), SNAP (╬▓=0.631, p<0.01), DML (╬▓=-0.631, p<0.01), CMAP (╬▓=0.59, p<0.01), and motor velocity (╬▓=0.515, p<0.01) (Table 5). Finger-to-wrist sensory nerve conduction velocity (╬▓=0.720, p < 0.01) was revealed as a significant contributing factor for RMS.
Discussion
The purpose of this study was to determine if SEMG could provide additional information to NCS in patients with mild CTS by investigating whether there are significant changes in SEMG signals in patients with mild CTS and sensory abnormalities, and examining the correlation between changes in SEMG signals and conventional NCS, according to the severity in CTS patients.
CTS responds well to early diagnosis and treatment, while irreversible injury to the median nerve can result in permanent sequelae. Thus, early diagnosis is crucial to prevent irreversible nerve damage.15 Provocative tests such as Phalen's test and Tinel's tests are used to diagnose CTS. The sensitivity of PhalenŌĆÖs test varies from 67-83% and the specificity varies from 40-98%. The sensitivity of TinelŌĆÖs test ranges from 48-73% and the specificity ranges from 30-94%. However, the prognostic and diagnostic values of these tests are questionable. Thus, NCS is combined with provocative tests.16
Electrophysiological studies help to differentiate other diseases associated with symptoms of pain, numbness, and paresthesia. It has been reported that an increase in carpal tunnel pressure due to biomechanical overload leads to structural and functional abnormalities in nerve fibers.17 Standard NCS usually reveals the effect of demyelination of the median nerve at the wrist by showing reductions in nerve conduction velocity. In our study, the results of conventional NCS con’¼ürmed signi’¼ücant differences between the control and CTS groups. A worsening trend of median nerve conduction values was observed going from the control to the CTS group. This ’¼ünding can be explained by the damage to the myelin sheath across the carpal tunnel due to patient exposure to biomechanical overload of the hand-wrist segment.
For the SEMG parameter, significant differences in amplitude signals (RMS) between the moderate-to-severe group and the control group were found. The RMS value is a frequently selected parameter because it reflects the level of the physiological activities of the motor unit during contraction.18 The RMS value in the moderate-to-severe group correlated with all NCS parameters in this study. These changes in RMS values in CTS patients indicate decreased motor unit recruitment. This result implies the loss of ability to recruit available motor units due to a decrease in muscle power from motor unit loss or defensive behavior against movement-evoked pain.
Among NCS parameters, the finger-to-wrist sensory nerve conduction velocity was found to be the most influential in the simple linear regression analysis between the RMS and the NCS parameters. It is known that sensory NCS showed abnormalities in the earlier stage compared to motor NCS studies. Previous research has verified that decreased sensory velocity showed the highest sensitivity among various NCS parameters in CTS patients.19 Moreover, the palmar branch of the median nerve innervates the APB muscle. The sensory nerve may be activated when the thumb is abducted, thus influencing the SEMG results.
The NME value is higher in the mild group than in the control group. We assume that this finding could be due to fewer subjects in the mild group. Moreover, changes in NME values were not statistically significant, and although the NME value implemented at 100% MVC was lower in the moderate-to-severe group than in the mild group, it was similar to that in the control group.
This result is consistent with the findings of Rainoldi et al.'s study that showed a significant difference in NME values in the control group and the CTS group at 10% MVC and 20% MVC, but the difference in NME values was not significant at 30% MVC and 80% MVC.6 Lower NME values observed in the moderate-to-severe group (compared with the mild group) could suggest an effective loss of motor units. The reduced capacity of the muscle to generate force for a reference amount of electrical activity has been related to an impairment of excitation-contraction coupling and can be considered as further evidence of the pathology effect.20
Alterations of MDF and MNF obtained by analyzing muscle electrical signals by surface EMG spectrum are frequently used as fatigue indices in EMG. In this study, the value of MDF and MNF decreased in the order of the control group, the mild group, and the moderate-to-severe group. However, this decrease did not show statistical significance.
Muscle fatigue is defined as the failure to maintain the desired or expected force, or a decrease in neuromuscular function when performing work or exerting force.21,22 MDF and MNF are proportional to the action potential conduction velocity and the recruitment and proportion of fast-twitch fiber.23,24 Local muscle fatigue slows the action potential conduction velocity, followed by a decrease in the recruitment of fast-twitch fibers and an increase in the recruitment of slow-twitch fibers. The MDF and MNF slide to the low-frequency range as a consequence.25 As a result, APB muscles can better withstand fatiguing contractions over time. This hypothesis can be supported by observations that muscle fibers can change the phenotype under different conditions, such as mechanical loading, denervation, and aging. These factors can lead to adaptations in muscle composition by inducing a fast-to-slow shift of fiber-type.26 In CTS, the damage mainly affects fast nerve fibers (large myelinated fibers). Thus, in the event of an axial loss, subsequent muscle damage may be an effective loss of fast-twitch fiber.
There are some limitations to this study. First, the amplitude values are affected by several factors, such as the thickness of the subcutaneous layer, anatomic location of the recruited motor unit associated with the electrode position, and the motor unit discharge rates.27 Second, large-scale studies are needed to confirm the results of this study as the control group and the mild group had fewer subjects than the moderate-to-severe group. Third, SEMG outcomes may vary depending on the degree of patient volition and may be more sensitive to the influence of surrounding muscles than conventional EMG.28
Conclusion
In conclusion, the contributions of this study can be summarized as follows: (a) Only RMS of the SEMG parameters showed a significant reduction in value compared to the moderate-to-severe CTS group and the control group, but not the mild group. (b) For SEMG parameters and NCS parameters, a significant correlation was established between RMS values and the mid-palm-to-wrist sensory nerve conduction velocity in the mild group. RMS and all NCS parameters showed a significant correlation in the moderate-to-severe group. Based on the results of this study, SEMG does not supplement conventional NCS in patients with mild CTS. However, SEMG can support conventional NCS to some extent in patients with moderate-to-severe CTS.